A Tale of Two Seasons

It Was the Best of Times, It Was the Worst of Times…
With 2018 behind us, this edition of Cutting Through the Noise looks back on what drove positive asset performance through the first three quarters of the year, and conversely what collectively caused every major asset class except for high quality bonds (just barely), to end the year in negative territory. We will reserve our 2019 market and economic outlook for our next blog, so we can focus acutely on “what the heck just happened?” Let’s dive in!
The first three quarters of 2018, while decidedly more volatile than 2017, provided a nice, comfortable summer backdrop, allowing the domestic stock market to grow under the old farmer’s adage “make hay while the sun shines” (yes, my Midwestern roots are showing). The domestic stock markets climbed like feed corn heading into harvest to a historical high in prices, which coincided with the summer solstice and end of the 3rd quarter; the end of the harvest.
The table below provides the details.
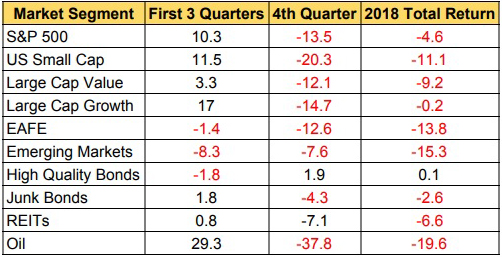
Then Q4 hit, and hit with a vengeance. A Game of Thrones-style bear market winter arrived, wiping out the first three quarters’ crops, and pushing almost all equity markets down 20% across the globe, before a comparatively small year-end rally retraced some of the losses.
As reflected above, the first three quarters saw a largely “risk on” market for equities and commodities. This environment was fueled by a new, lower corporate income tax structure, massive repatriation of overseas tax monies, and investor belief that the Fed would continue to be supportive of equity markets and provide excess liquidity and lower (or at least level) interest rates during market sell offs, as previous Fed governors have delivered.
All of that seemed to change in the fourth quarter, as the Fed’s determination to display its independence stepped to the fore and all of a sudden there was a lot less certainty about how high rates might be raised and how low market prices might be allowed to drift.
This, coupled with a confluence of global issues including an escalating trade war with China, a looming and seemingly poorly-planned U.K. Brexit, a flattening (and in some cases, inverted) yield curve, and tightening European Central Bank monetary policy, caused the market to hit an air pocket in December and reset 10-20% lower across the board.
The Dow ended the year with its worst December since the Great Depression (1931). Also noteworthy is the fact that every country finished in the red, with China doing the worst (-28.3%) and Brazil holding up the best (- 2.8%).
To put that in perspective, on average, equity prices at any given point in time can be up to 20% over or undervalued. Many would argue that the market just took out some excess and is now priced at fair value, based on historical P/E ratios of 15… as long as the market avoids a recession.
That said, let’s put the recent sell off in context and discuss what the market has done after similar draw-downs throughout history. For reference, the most recent 4th quarter 2018 draw-down was -17%, and thus it would fall at the bottom of the table below as the 14th largest quarterly decline in the past 100 years.
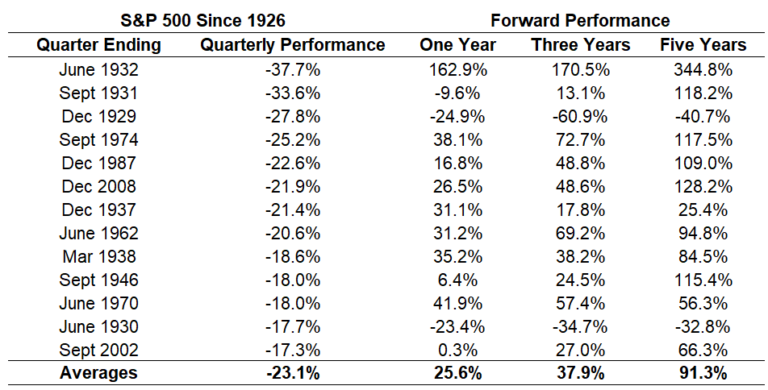
Accordingly, taking away the Great Depression examples of the 1930’s and based on historical returns, we can reasonably expect the market to perform just fine over the next 1, 3, and 5 year periods. Remember Uncle Warren’s favorite saying, “Be greedy when others are fearful, and fearful when others are greedy.” It’s actually written on our website…
The 2018 Weather Reports that Changed the Seasons
Broadly speaking, the market was most impacted by two big, disparate systems in 2018. The first is categorized as fiscal policy, while the second is good ole monetary policy.
- Trade tensions and impact on GDP and inflation
- Interest rate yield curves and Central Bank policy
We previously covered these two important elements in our trade and flat yield curve blogs, so we’ll stick to the high points, and how they ultimately negatively impacted the markets in Q4.
Trade Tensions
Trade tensions continued to rise throughout the year. Initially, stricter trade policies were broadly directed at all US trading partners. Ultimately, the tariff proposals became more focused on China throughout the year. These policies currently cover half of all Chinese imports into the US, but that could soon grow to 100% (see exhibit 4 below).
That said, the analysis points to a relatively small direct impact of these tariffs on global growth. There were some encouraging signs of progress, such as the completion of a new NAFTA 2.0 trade deal between the US, Canada, and Mexico. The real risk still remains to be the dissolution of the World Trade Organization, but for now, trade tensions appear negligible/manageable from a growth perspective.
Trade War – Threat to Reality
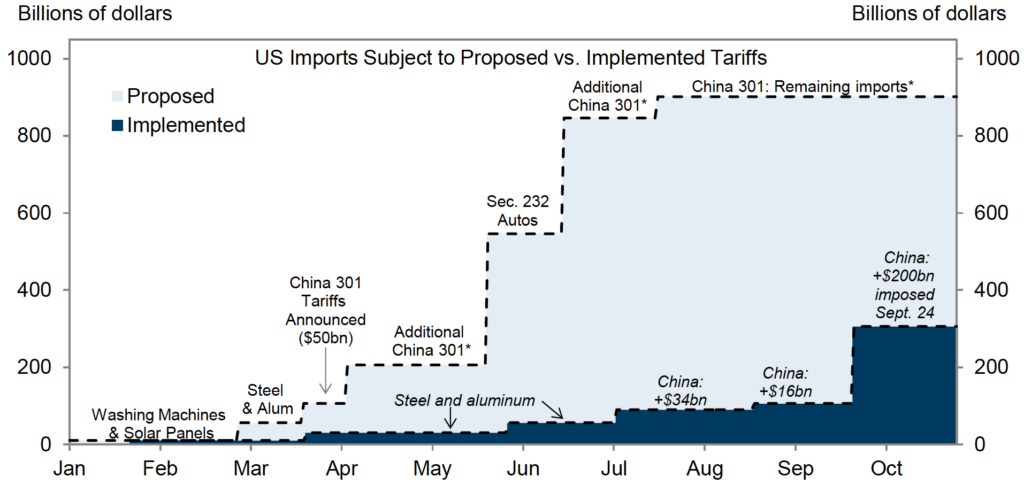
Source: Goldman Sachs Global Investment Research
The chart below shows how small the impact of comprehensive trade policies are expected to be for most of the world. The net impact to US GDP is estimated to be around 0.1% per year over the next three years. As expected, the direct impact on China will be a bit more significant, but likely not enough to trigger a “hard landing”.
Tariffs’ Economic Impact Mild
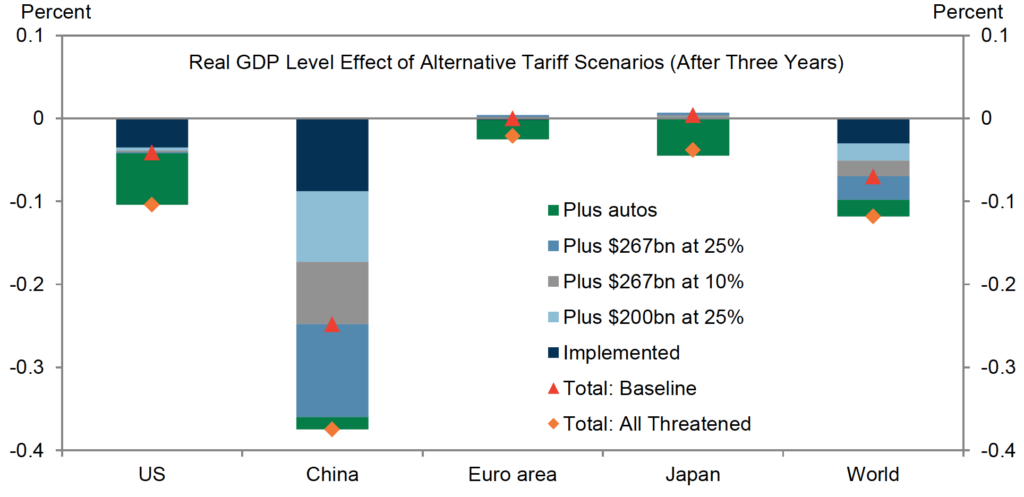
Source: Goldman Sachs Global Investment Research
The next chart shows the expected impact of tariffs on inflation. This is where the rubber hits the road for the Fed. This is also where fiscal policy begins to impact monetary policy. At present, inflation is bumping up against the lower level of the acceptable range for the Fed, at a 2.0% inflation rate. Due to this backdrop, the Fed’s proclivity toward higher rates is understandable, particularly if the low unemployment rate continues to fuel rising wage pressures.
In short, the combined effects of cutting taxes and creating unprecedented fiscal stimulus with the economy so near full employment, coupled with the impact of expected higher inflation passing through from tariffs, is unsettling for the Fed.
US Suffers Most From Tariffs’ Inflationary Effects
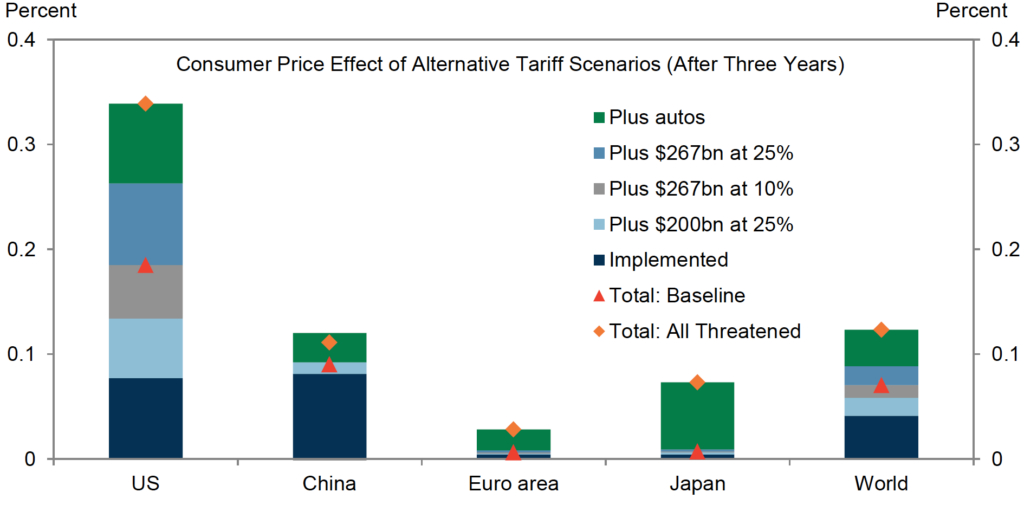
Source: Goldman Sachs Global Investment Research
Due to the potential for rising inflation, the Fed needs to be seen as independent and willing to take difficult measures to keep inflation under control. Keeping the market’s confidence is even more important given the historically high debt levels in almost all segments of the economy. Fed independence has become a legitimate challenge, due to unprecedented presidential criticism of the Federal Reserve Chairman. This battle will be an important storyline in 2019.
Interest Rates and Central Bank Policy
Several central banks, led by the Fed, continued to hike rates throughout the year, despite the combination of weaker growth expectations and tighter financial conditions. Tighter financial conditions helped to shift the policy narrative as the year progressed.
The Fed implemented four hikes, but it importantly indicated a dovish shift at the end of the year. The risk of a 2020 ECB (European Central Bank) liquidity unwind also intensified at year end. Meanwhile in China, monetary policy started easing as credit supply started to meaningfully drag on growth.
Let’s start the monetary discussion overseas. It’s important to understand that since commencing its Quantitative Easing (QE) equivalent program in 2012, the ECB has injected approximately 3x the liquidity into the monetary system as did our Federal Reserve Bank.
As such, Mario Draghi’s communication in November that the ECB would effectively end the program will likely be far more impactful than the Fed’s tapering of its domestic program over the past 18 months. Two of the three big fire hoses that have been drenching the monetary system with liquidity are now dry, with only the BOJ (Bank of Japan) left to flood the fields.
We will be addressing this issue in far more detail later in the year, but for now, suffice it to say that monetary conditions are tightening and that can best be seen in the below chart. We are now approaching financial conditions on par with what was seen in early 2016, which triggered a growth slowdown. These conditions will undoubtedly be exacerbated if the ECB follows through with their tapering program.
Fed Tightens 150bps in 2018
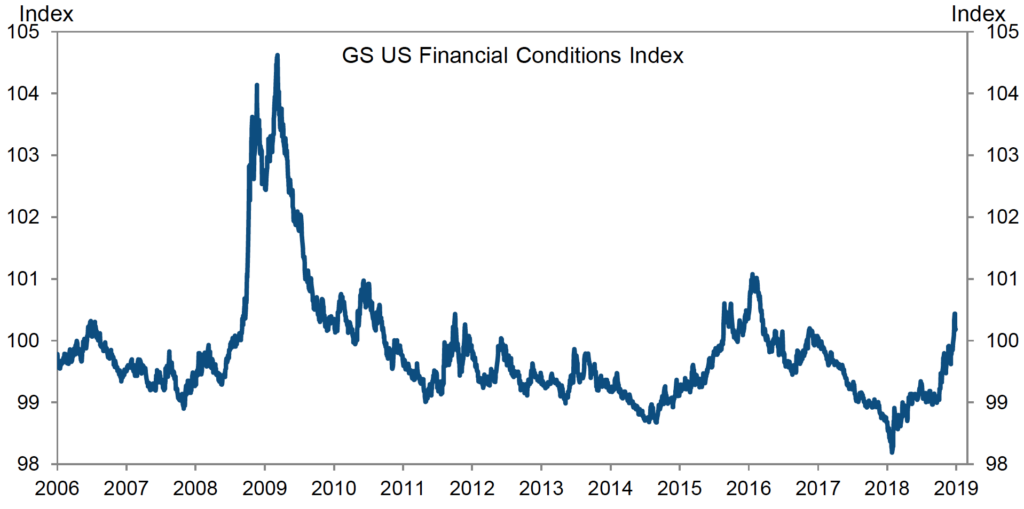
Source: Goldman Sachs Global Investment Research
Next up is the impact of the 2-10 year government bond yield curve spread, which is now as narrow as it has been since 2008 at ~20 bps. Since the market is now pricing in less than one Fed interest rate hike next year, the news that the Fed themselves are still calling for two hikes has put the market on edge. Two rate hikes has resulted in recession 100% of the time since 1950, within 20 months.
Flattening Treasury Yield Curve

Source: Federal Reserve Bank of St. Louis
All of the uncertainty created by central bank and trade policies has also lowered growth metrics throughout the year. We can see that the Global Growth Momentum Index illustrated below peaked after passage of the Tax Cuts & Jobs Act at the end of 2017. The impact of those cuts has now largely worn off. This reality, combined with all the other issues discussed above, has led the global economy to soften to a level more in line with the moderate growth period of 2014-2016.B
Global Growth Slowed in 2018

Source: Goldman Sachs Global Investment Research
Are the Weather Satellites Forecasting An Early Spring?
Looking back we experienced a very interesting and highly volatile year. Importantly, last year set us up for even more interesting times ahead. The forecast promises increased volatility and the potential for a real slow down in the economy – the first in over 10 years.
Specifically, we saw the beginning of some potentially concerning trends: softer global growth and increasing inflation. These trends started due to the interaction of specific fiscal policies related to trade and tax cuts, coupled with the desyncing of global monetary policy, and resulted in a massively negative December and Q4 overall.
For many investors who have generated their wealth in the last decade, this could be their first encounter with a substantial bear market. This environment will challenge many notions about the wisdom of passive only ETF’s and index funds which do well when markets go up due to their low cost, but are often highly correlated on the downside and offer little to no protection.
Next month we will analyze the Doppler radar to highlight some of the forces that are coming our way and will be important to the 2019 economy and asset prices.
We wish you and your families a Happy New Year!